







GAME PROFILE
Store overview
Ratings, downloads, release details, and screenshots from the available app stores.
Mobile game profile
Where's My Water?
Everyone| Store data | Google Play | Apple App Store |
|---|---|---|
| Rating | 4.3/ 5 | 4.0/ 5 |
| Downloads | 1,000,000+ | 40K+ |
| Release date | November 22, 2011 | September 22, 2011 |
| Reviews | 197,728 | 338 |
| Last update | July 5, 2023 | July 6, 2023 |
| View | Google Play | App Store |
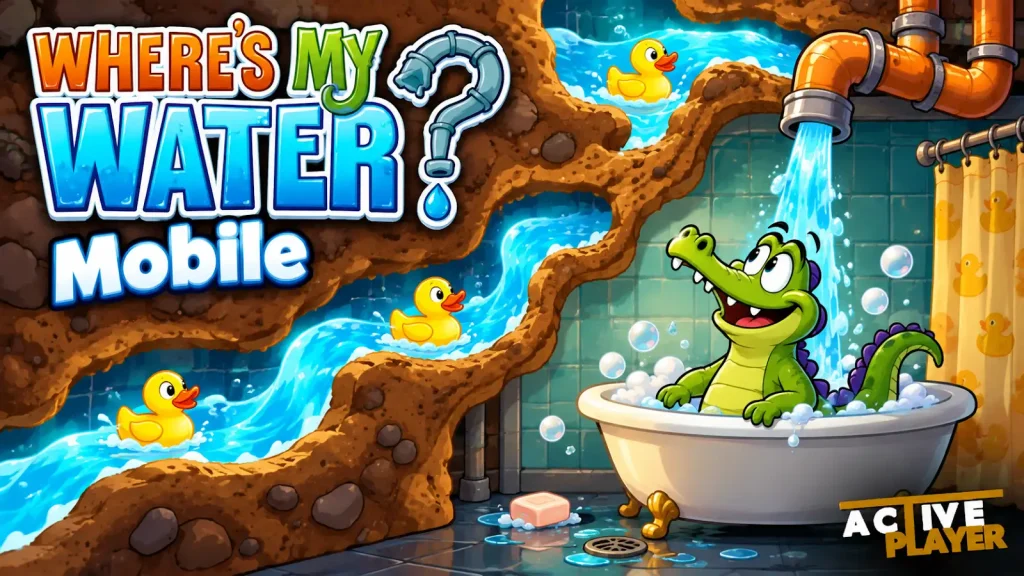
Where's My Water? is a physics-based puzzle game about guiding water through underground obstacles. Players dig through dirt to deliver water to Swampy’s broken shower. Different liquids, steam, and timing challenges make each puzzle more complex.
Features
- Physics-based puzzles: Control water flow by carving paths through dirt.
- Four stories: Follow Swampy, Allie, Cranky, and Mystery Duck.
- Over 500 puzzles: Solve increasingly challenging levels across the stories.
- Different substances: Work with fresh water, dirty water, toxic water, steam, and ooze.
- Collectibles and bonus levels: Collect ducks and special items to unlock extra challenges.
Some stories require additional purchases.
Player Statistics
Explore monthly player data and concurrent player counts for Where's My Water? to track changes in player activity over time.
About ActivePlayer.io
Visit activeplayer.io for more game statistics and player activity insights.
In-game preview
Where's My Water? screenshots
Where's My Water? is a Puzzle app available on both Android and iOS platforms.
PLAYER ACTIVITY
Player estimates & insights
Compare estimated activity across Google Play and the App Store. These figures are updated monthly.
Where's My Water? Player Data Analysis
- Player Statistics
- Insights
Google Play
App Store
Summary
Where's My Water? has player statistics available for both Google Play and App Store.
Verdict
Where's My Water? has a substantial player community with a significantly larger player base on Android. The game maintains approximately 124.0K monthly active users across both platforms.
Engagement Analysis
Both platforms show similar daily engagement levels (Android: 16.7%, iOS: 24.2%).
Platform Comparison
Current Player Count
Google Play has approximately 51.0x more current players than App Store.
Daily Active Users
Google Play has approximately 20.4x more daily active users than App Store.
Monthly Active Users
Google Play has approximately 29.6x more monthly active users than App Store.
HISTORICAL DATA
Monthly player history
Compare estimated monthly players and changes over time. Select a store to view its history.
Where's My Water? Monthly Player Trends
| Month | Estimated Players | Change | % Change | Data Points |
|---|---|---|---|---|
| October 2026 | 79.2K | +6.6K | +9.1% | 1 |
| September 2026 | 72.6K | -2.3K | -3.0% | 1 |
| August 2026 | 74.9K | +8.0K | +11.9% | 1 |
| July 2026 | 66.9K | -5.7K | -7.9% | 1 |
| June 2026 | 72.6K | -1.8K | -2.4% | 1 |
| May 2026 | 74.4K | -7.2K | -8.8% | 1 |
| April 2026 | 81.6K | -15.8K | -16.3% | 1 |
| March 2026 | 97.4K | +22.4K | +29.9% | 1 |
| February 2026 | 75.0K | -2.4K | -3.1% | 1 |
| January 2026 | 77.4K | +3.0K | +4.0% | 1 |
| December 2025 | 74.4K | -6.5K | -8.0% | 1 |
| November 2025 | 80.9K | +4.7K | +6.1% | 1 |
Where's My Water? Monthly Player Trends
| Month | Estimated Players | Change | % Change | Data Points |
|---|---|---|---|---|
| October 2026 | 24.0K | +2.0K | +9.1% | 1 |
| September 2026 | 22.0K | -691 | -3.0% | 1 |
| August 2026 | 22.7K | +2.4K | +11.9% | 1 |
| July 2026 | 20.3K | -1.7K | -7.8% | 1 |
| June 2026 | 22.0K | -546 | -2.4% | 1 |
| May 2026 | 22.5K | -2.2K | -8.8% | 1 |
| April 2026 | 24.7K | -4.8K | -16.3% | 1 |
| March 2026 | 29.5K | +6.8K | +29.9% | 1 |
| February 2026 | 22.7K | -727 | -3.1% | 1 |
| January 2026 | 23.4K | +908 | +4.0% | 1 |
| December 2025 | 22.5K | -2.0K | -8.0% | 1 |
| November 2025 | 24.5K | +1.4K | +6.1% | 1 |
SEARCH INTEREST
Regional interest
Relative search interest by region on a 0–100 scale. Interest scores are not player counts or shares of the player base.
/m/0hr9t7r - Regional Interest
Top Regions by Interest
| Region | Interest Score |
|---|---|
| Cuba | 100 |
| Bolivia | 41 |
| Russia | 35 |
| Belarus | 32 |
| China | 32 |
| Chile | 16 |
| Costa Rica | 16 |
| Guatemala | 16 |
| Iraq | 16 |
| Peru | 16 |
| United States | 16 |
| Ecuador | 12 |
| Malaysia | 12 |
| Mexico | 12 |
| New Zealand | 12 |
| Philippines | 12 |
| Singapore | 12 |
| Syria | 12 |
| Taiwan | 12 |
| Argentina | 9 |
| Australia | 9 |
| Canada | 9 |
| Colombia | 9 |
| Dominican Republic | 9 |
| Egypt | 9 |
| Hong Kong | 9 |
| Iran | 9 |
| Ireland | 9 |
| Israel | 9 |
| Kazakhstan | 9 |
AUDIENCE ANALYSIS
Player count analysis
Explore estimated player trends, growth, seasonality, and forecasts. Projections describe possible outcomes.
Where's My Water? - Player Count Analysis
Current Player Base
As of October 2026
Key Insights
- Where's My Water? currently has approximately 79.2K monthly active players.
- Player base grew by 9.1% in the last month, adding 6,600 new players.
- Peak player count was 97.4K in March 2026, current count is 81.3% of that peak.
Growth Metrics
Monthly Growth
| Period | Change | Percentage |
|---|---|---|
| September 2026 to October 2026 | +6.6K | 9.1% |
| August 2026 to September 2026 | -2.3K | -3.0% |
| July 2026 to August 2026 | +8.0K | 11.9% |
| June 2026 to July 2026 | -5.7K | -7.9% |
| May 2026 to June 2026 | -1.8K | -2.4% |
| April 2026 to May 2026 | -7.2K | -8.8% |
| March 2026 to April 2026 | -15.8K | -16.3% |
| February 2026 to March 2026 | +22.4K | 29.9% |
| January 2026 to February 2026 | -2.4K | -3.1% |
| December 2025 to January 2026 | +3.0K | 4.0% |
| November 2025 to December 2025 | -6.5K | -8.0% |
| October 2025 to November 2025 | +4.7K | 6.1% |
Trend Analysis
Player Count Trend
Seasonality
Summary
Potential seasonal peaks detected in March
Correlation Analysis
Summary
Very strong positive correlation between trend values and player counts
Future Projections
Projected Player Count
Summary
Based on recent trends, we project continued growth at approximately 2.8% per month
CONTEXT MATTERS
Understanding the numbers
Store statistics, player estimates, and search interest measure different kinds of activity. Compare each signal over time, and check the update dates in each section.
How ActivePlayer collects dataAre these live player counts?
Mobile player figures are estimates, updated on the schedule shown by each source. They are not a real-time count of connected players.
Are downloads the same as active players?
No. Downloads, ratings, daily activity, and monthly activity are different metrics. Store totals should not be added together to infer a unique player count.
What does regional interest show?
Search interest is a relative score from 0 to 100. It describes search attention, rather than the percentage of players in a country.
